


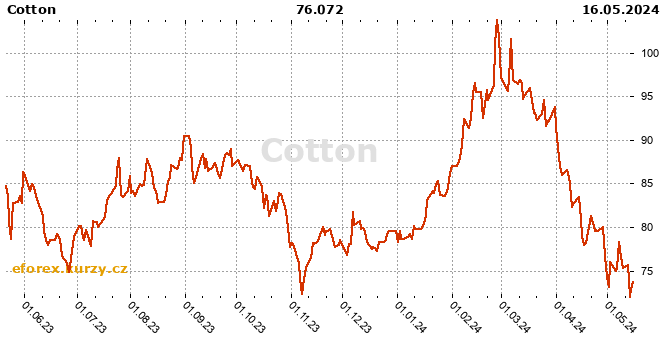
Cotton, Commodities history
Cotton history chart, last update July 9, 2026
Cotton onlineLoading....
Last 15 days history
| Date | Middle |
| July 9, 2026 | 80.543300 |
| July 8, 2026 | 80.546700 |
| July 7, 2026 | 81.270000 |
| July 6, 2026 | 78.592500 |
| July 3, 2026 | 77.130000 |
| July 2, 2026 | 77.112500 |
| July 1, 2026 | 77.902500 |
| June 30, 2026 | 76.780000 |
| June 29, 2026 | 76.440000 |
| June 26, 2026 | 76.145000 |
| June 25, 2026 | 76.940000 |
| June 24, 2026 | 76.145000 |
| June 23, 2026 | 78.560000 |
| June 22, 2026 | 79.350000 |
| June 19, 2026 | 79.730000 |
Cotton history chart
Time: July 13, 2026, 6:57 a.m.
| London time: | July 13, 2026, 6:57 a.m. |
| NY time: | July 13, 2026, 1:57 a.m. |
| Tokyo time: | July 13, 2026, 2:57 p.m. |